
As discussed in the previous post (Global Economic Crossroads), India’s economic slowdown in late 2024 highlights a complex interplay between inflation and growth, a relationship that can be explored through the Phillips Curve framework. Traditionally, the Phillips Curve suggests an inverse relationship between inflation and unemployment; as inflation rises, unemployment tends to fall, reflecting a trade-off that policymakers must navigate. However, recent developments in India challenge this conventional wisdom, as rising inflation coincides with reduced economic growth and increasing unemployment risks.
Inflation, driven by escalating costs of goods and services, erodes purchasing power and dampens consumer spending. This slowdown in demand cascades across sectors, stalling production, investment, and innovation. Moreover, diminishing foreign capital inflows exacerbate the economic deceleration by restricting opportunities for job creation and technological advancement. These dynamics suggest a deviation from the traditional Phillips Curve, underscoring the urgency for nuanced policy interventions.
As policymakers, including the Reserve Bank of India (RBI), strive to stabilize the economy, the Phillips Curve offers a valuable lens. By balancing inflation control measures, such as monetary tightening, with growth-stimulating strategies, such as targeted easing, the RBI aims to mitigate the inflation-unemployment trade-off. This adaptive approach can reshape the Phillips Curve, reflecting an economy that sustains growth while managing inflation expectations.
India’s current economic scenario thus serves as a real-world illustration of how inflationary pressures and policy responses interact within the Phillips Curve framework, offering insights into the challenges and opportunities of macroeconomic management.
Understanding the Phillips Curve
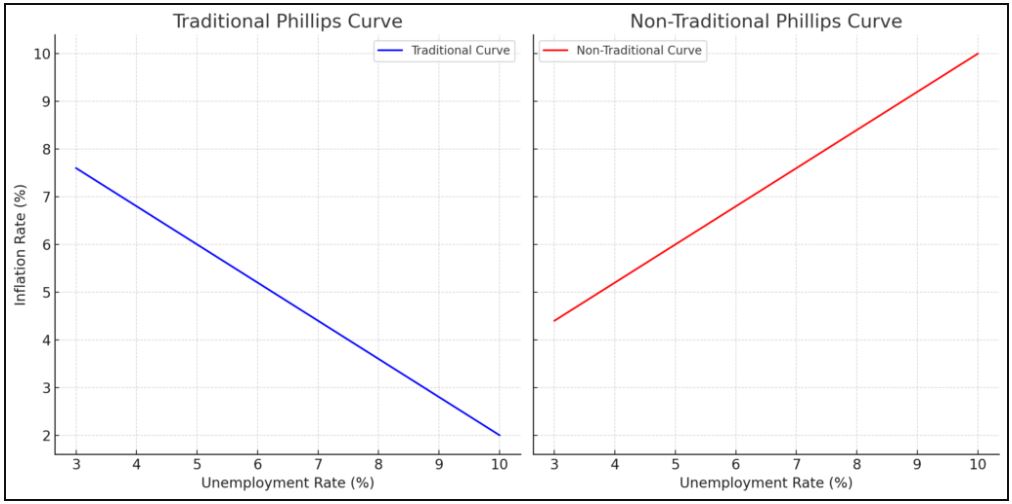
To analyze India’s economic challenges through the Phillips Curve, we will explore the trade-off between unemployment and inflation while addressing how the Reserve Bank of India’s (RBI) policy steps might influence this relationship. The Phillips Curve illustrates an inverse relationship between inflation (π) and unemployment (u), expressed as:
$π=π_e−β(u−u_n)$
where:
- π is the actual inflation rate.
- $π_e$ is the expected inflation rate.
- u is the actual unemployment rate.
- $u_n$ is the natural rate of unemployment.
- $β$ reflects the sensitivity of inflation to unemployment.
India’s Economic Situation (2024)
- Inflation Increase: Rising prices reduced consumer spending, eroded purchasing power, and discouraged investment.
- Growth Decline: GDP growth slowed to 5.4%, which could indicate rising unemployment.
- Foreign Investment Decline: Economic uncertainty discouraged capital inflows, reducing job creation and innovation.
Source: Generated by author.
This suggests movement along the Phillips Curve where higher inflation (π) corresponds with higher unemployment (u)—deviating from the traditional inverse relationship.
Policy Steps by RBI
To address the dual challenge of inflation and growth, the RBI might:
- Raise Interest Rates (Tightening Monetary Policy): Aimed at controlling inflation by reducing demand.
- Why? When inflation rises, the cost of goods and services increases, reducing the purchasing power of people. By raising interest rates, borrowing becomes more expensive for businesses and individuals. This discourages excessive spending and investment, which helps cool down the overheated economy.
- How Does It Help? Higher interest rates reduce the money circulating in the economy, which lowers demand for goods and services. As demand decreases, businesses are less likely to raise prices, easing inflationary pressure.
- Stimulate Investments (Easing Monetary Policy): Targeted interventions like reducing repo rates or incentivizing credit flow to boost economic activity and employment.
- Why? While raising interest rates controls inflation, it may also slow economic growth. To counteract this, the RBI can offer lower interest rates or financial incentives for specific sectors that need support. For example, encouraging investment in infrastructure or small businesses ensures these sectors continue to grow even as inflation is managed.
- How Does It Help? This approach stimulates production and employment in critical areas, partially offsetting the potential increase in unemployment from higher overall interest rates.
- Impact on the Graph and Phillips Curve Expression:
- Graphical Change:
Raising interest rates shifts the economy along the Phillips Curve toward lower inflation but higher unemployment in the short run. However, targeted easing measures can help flatten the curve, reducing the inflation-unemployment trade-off. This reflects a more efficient economy where inflation control doesn’t severely impact employment. - Mathematical Change:
The initial Phillips Curve was represented as: $π=π_e−α(u−u_n)$
After the intervention:- Raising interest rates: Reduces π (inflation) by increasing u (unemployment).
- Targeted easing: Lowers the sensitivity of inflation to changes in unemployment (α), making the curve less steep.
- Graphical Change:
New expression:
$π=πe−β(u−u_n)$, where β<α,where β<α
This modified Phillips Curve implies a smaller trade-off between inflation and unemployment due to more effective policy interventions i.e. inflation decreases without increasing unemployment to an alarming value.
Mathematical Explanation of Shifts
The adjustment process can be modeled as:
$π_t=π_{t−1}−α(π_t−π_e)−β(u−u_n)$
where:
- α accounts for policy-driven changes in inflation expectations.
- β captures the effect of unemployment on inflation.
RBI’s steps influence $π_e$ (expected inflation) and α, reshaping the curve dynamically.
Graphical Representation
So from the discussion so far we have:
1. Tightening Monetary Policy
- Goal: Reduce inflation (π) at the cost of potentially higher unemployment (u).
- Graphical Representation: Movement downward along the Phillips Curve (the red dot will move along the blue line towards right) as inflation falls but unemployment rises.
2. Easing Monetary Policy
- Goal: Stimulate growth and reduce unemployment (u) at the cost of higher inflation (π).
- Graphical Representation: Movement upward along the Phillips Curve (the red dot will move along the blue line towards left) as unemployment decreases but inflation rises.
3. Dynamic Adjustments:
Expectations ($π_e$): If inflation expectations are anchored due to credible RBI policies (reducing inflation by keeping unemployment constant at the natural unemployment level i.e. $u_n$), the Phillips Curve could shift inward, reducing inflation without significant unemployment.
Based on the above discussions following graph can be created:
Source: Generated by author.
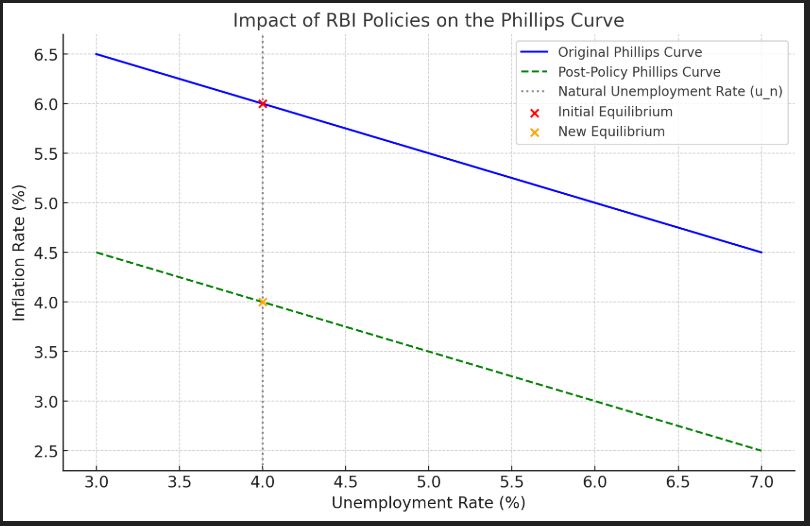
Graph Explanation
- Original Phillips Curve (Blue Line): Reflects the inverse relationship between inflation and unemployment before RBI’s intervention.
- Post-Policy Phillips Curve (Green Dashed Line): A shift to the left due to reduced inflation expectations ($π_e$) after credible policy measures.
- Natural Unemployment Rate ($u_n$): The vertical line indicates the long-term equilibrium unemployment rate(here $u_n = 4%$).
- Initial Equilibrium (Red Dot): Shows higher inflation at $u_n$.
- New Equilibrium (Orange Dot): Reflects reduced inflation at $u_n$, demonstrating RBI’s success in managing inflation expectations without a significant rise in unemployment.
Conclusion
Through a combination of tightening (to reduce inflation) and easing (to sustain growth) measures, the RBI can reshape the Phillips Curve, shifting it inward. This reflects a better trade-off, helping India balance inflation control and economic growth.
Kicking off the New Year with a fresh take on the inflation-growth paradox? This article is the perfect brain workout! A fantastic breakdown of India’s Phillips Curve, making even the trickiest concepts easy to grasp. What a way to start 2025!
Who needs fireworks when you’ve got the Phillips Curve lighting up your New Year? This article is an incredible blend of insightful analysis and clarity—like the economic toast to a brand-new year!