Getting the basics right before diving into machine learning and cloud forecasting.
E-commerce and retail businesses operate in an environment of high demand variability, frequent sales spikes, and rising customer expectations for availability. From festive surges to payday peaks, having the right product at the right place and time is critical.
In this part of the series, we explore how retailers like Amazon, Flipkart, and BigBasket use classical forecasting techniques for SKU-level predictions, helping prevent stockouts, manage promotions, and drive fulfillment efficiency — all before layering on advanced AI.
🛍️ Use Case: Inventory Planning and Promotions
Let’s imagine you’re managing a top-selling SKU in an online grocery platform. Your job is to ensure:
- Enough stock to fulfill demand spikes (e.g., festivals, long weekends)
- Minimal overstock to avoid wastage or excess holding costs
- Seamless customer experience, even during flash sales
To make this possible, basic time series forecasting tools like moving averages and seasonality decomposition can go a long way.
📦 What Are SKUs and Why Forecast Them?
A Stock Keeping Unit (SKU) is a unique identifier for each distinct product and service that a company offers. It typically encodes characteristics like:
- Product type (e.g., 1-liter cold-pressed orange juice)
- Brand or supplier
- Size, color, and packaging
Forecasting at the SKU level means generating individualized forecasts for each item. This is vital because:
- High-demand SKUs may sell out quickly, causing stockouts
- Slow-moving SKUs may pile up, creating excess inventory
- Warehouse space, order fulfillment, and promotions all depend on SKU-level accuracy
Companies like BigBasket and Amazon manage tens of thousands of SKUs, each with distinct demand patterns. Accurate SKU-level forecasting helps reduce holding costs and improves customer satisfaction by ensuring product availability.
We then applied:
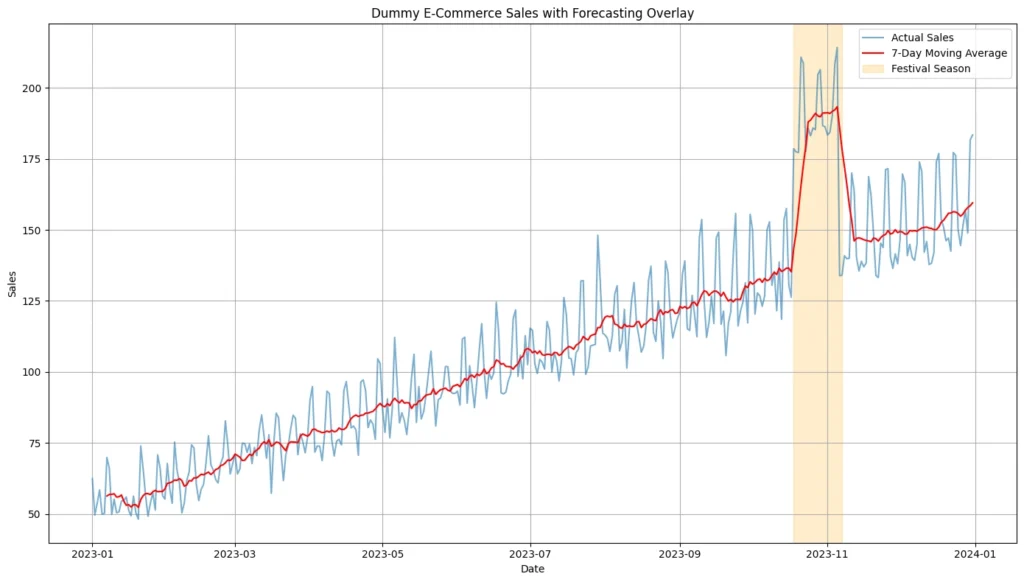
✅ 7-Day Moving Average to smooth short-term fluctuations
✅ Seasonality Decomposition to extract trend + seasonal components
These forecasts help anticipate surges and avoid inventory pitfalls.
📈 Forecasting Visualization
Sales vs Forecast

Overlaying actual sales and 7-day moving average forecasts
(Festival demand window shaded for context)
As seen in the plot, moving averages lag during demand spikes, highlighting the limitations of basic methods. Still, they offer a strong baseline for short-term planning.
📉 Forecast Error and Stockout Risk
To evaluate our simple forecasting method, we calculated:
| Metric | Value |
|---|---|
| MAPE (Mean Absolute Percentage Error) | 7.61% |
| RMSE (Root Mean Squared Error) | 14.43 |
Even though a MAPE (Mean Absolute Percentage Error) of 7.61% may seem like a small error, it can still cause major problems when dealing with large volumes of products. For example, if you’re selling thousands of units across hundreds of SKUs, even a slight underestimation can lead to stockouts, where customers find items out of stock — hurting sales and customer trust. On the other hand, overestimating demand means ordering too much stock, which can tie up money, take up storage space, and lead to waste, especially for perishable items. These small forecasting errors become much more impactful during high-speed sales events like flash sales, festivals, or big promotions, where demand can change rapidly and unpredictably.
🔁 What’s Next?
This part focused on traditional forecasting methods that remain valuable in retail operations. But when data gets large, SKUs grow diverse, and events become less predictable — we need more power.
That’s where machine learning comes in.
In Part IV, we’ll explore how models like XGBoost, LSTM, and Prophet handle non-linear, multi-feature forecasts — and how they outperform traditional methods in long-term accuracy and robustness.

