
China’s recent economic trajectory has been marked by a sharp decline in its two-year bond yield, nearing the critical threshold of 1.00%. This alarming trend reflects growing deflationary pressures and questions about the effectiveness of monetary policy in stimulating growth. As policymakers grapple with these challenges, the IS-LM model offers a robust framework for analyzing the underlying issues and potential outcomes. Read more.
Mapping IS-LM concepts to China’s Current Situation
The IS-LM Model: A Primer
The IS-LM model, short for Investment-Savings (IS) and Liquidity Preference-Money Supply (LM), is a cornerstone of macroeconomic analysis. It illustrates the interaction between the real economy (output and investment) and the monetary sector (interest rates and money supply).
- IS Curve: Represents equilibrium in the goods market, where investment equals savings. A downward-sloping curve shows that lower interest rates lead to higher investment and output.
- LM Curve: Represents equilibrium in the money market, where money demand equals money supply. An upward-sloping curve shows that higher output increases money demand, which raises interest rates.
The IS-LM model is relevant to China’s current situation as it helps explain how falling bond yields, deflation, and central bank measures interact within the broader economy.
The Situation in China
China’s two-year bond yields have dropped precipitously due to weak economic demand and deflationary pressures. Deflation, characterized by falling prices, discourages consumption and investment, leading to slower economic growth. With consumers and businesses hesitant to spend, the economy remains below its potential output, and monetary policy struggles to generate momentum.
In IS-LM terms:
- IS Curve: Economic uncertainty and weak confidence have shifted the IS curve leftward, indicating reduced investment and consumption at all levels of interest rates.
- LM Curve: The People’s Bank of China’s (PBOC) measures to inject liquidity and lower interest rates are intended to shift the LM curve downward/rightward, reducing borrowing costs to stimulate economic activity.
Graphical and Mathematical Representation
Let’s delve into China’s economic situation through the lens of the IS-LM model, a foundational tool in macroeconomics. The IS-LM framework allows us to explore how interactions between the goods market and the money market influence output (GDP) and interest rates. Here, we’ll unpack how China’s deflationary pressures and policy responses affect its economy, using equations to guide the discussion.
Source: Generated by the author.
Setting the Stage: Initial Equilibrium
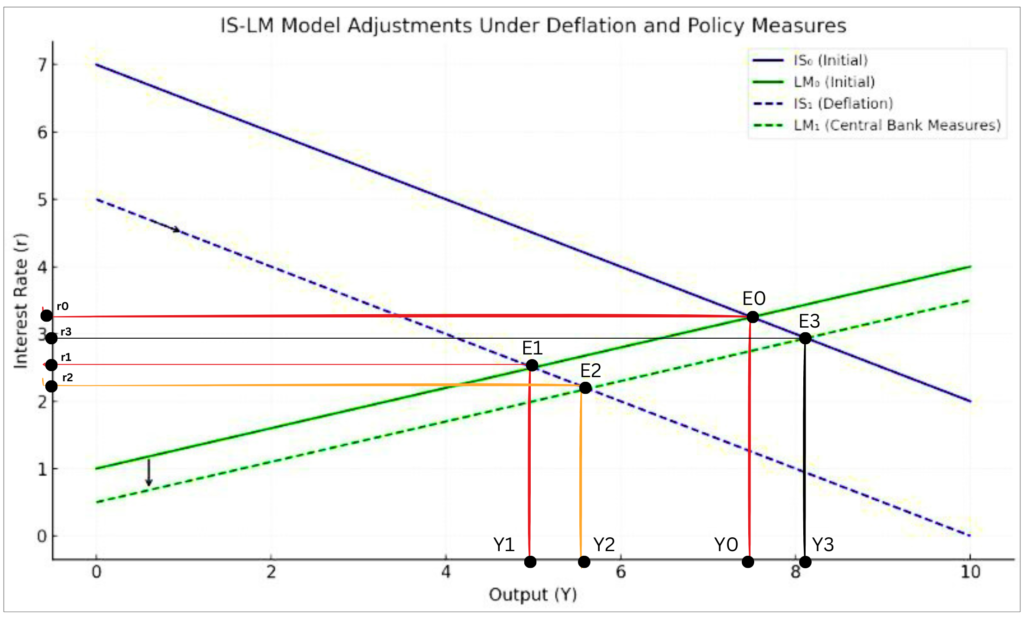
In the IS-LM model, the goods market is represented by the $IS_0$ curve, while the money market is captured by the $LM_0$ curve. These two curves intersect to determine the economy’s equilibrium, defined by the level of output (Y) and interest rate (r).
The IS curve reflects the relationship between output and interest rates in the goods market, balancing investment, consumption, and government spending. It changes when there are changes in the fiscal policies:
$Y=C(Y−T)+I(r)+G$
Here, C is consumption, T is taxes, I(r) is investment as a function of interest rates, and G is government spending. In simpler terms, the IS curve shows how changes in spending and interest rates affect overall economic activity.
On the other hand, the LM curve captures the equilibrium in the money market, balancing money supply (M) and demand (L(Y,r)). The curve changes when there are changes in the monetary policies:
$M/P=L(Y,r)$
Where M/P is the real money supply, Y is income (or GDP), and r is the interest rate. The LM curve shows how money supply and demand interact with economic activity and borrowing costs.
Initially, China’s economy is at equilibrium, where the IS and LM curves intersect. This gives us output $Y_0$ and interest rate $r_0$. However, as deflationary pressures mount, this equilibrium is disrupted.
The Shock: Deflation and its Impact on the IS Curve
Deflation—a sustained decline in prices—has hit China’s economy. This phenomenon reduces consumer and business confidence. With the anticipation of falling prices, households delay consumption, and firms postpone investments, because they wait for the lowered prices in the near future, this reduces the current overall demand.
In the IS-LM model, this translates to a leftward shift of the IS curve ($IS_0$ curve shifts left to $IS_1$) as autonomous spending (A) declines:
$r_1=(1/b)(A’−Y)+c,A'<A$
Here, A′ represents the reduced level of autonomous spending, including government expenditure, investment, and consumption.
What does this mean for the economy? The new equilibrium (determined by the intersection of IS₁, the dotted blue line and LM₀, the dashed green line) shows:
- Lower output ($Y_1 < Y_0$): Economic activity slows as spending contracts.
- Lower interest rates ($r_1 < r_0$): With weak investment demand, borrowing costs fall.
This state of reduced demand and falling output exacerbates deflationary pressures, creating a vicious cycle that can further suppress growth.
Policy Response: Shifting the LM Curve
To combat deflation, China’s central bank has implemented aggressive monetary policies. By injecting liquidity into the system and lowering policy rates, the bank increases the real money supply (M/P), shifting the LM curve ($LM_0$ to $LM_1$) downward and to the right:
$r_2=(1/k)(m′−hY), m′>m$
Where m′=M′/P, the enhanced money supply adjusted for price levels.
This shift encourages borrowing and investment, aiming to stimulate demand. The new equilibrium (at the intersection of IS₁ and LM₁) results in:
- Higher output ($Y_2 > Y_1$): Economic activity begins to recovers as demand increases.
- Lower interest rates ($r_2 < r_1$): Further easing borrowing costs this will support growth by encouraging investments.
However, while monetary policy addresses liquidity constraints, it may not fully restore demand unless confidence is rebuilt. Because we can see from the graph that the new output after the monetary policy ($Y_2$) is greater than the output generated during the deflation ($Y_1$) but it is still lesser than the original output levels ($Y_0$).
Restoring Demand: Fiscal Policy and IS Curve Adjustments
Recognizing the limitations of monetary policy, the government may step in with fiscal measures—such as increased infrastructure spending or tax cuts—to boost autonomous spending (A) and shift the IS curve back to its original position ($IS₀$):
$r_3=(1/b)(A′′−Y)+c, A′′>A′$
These measures complement monetary efforts, aiming to restore output ($Y_3$) to pre-deflation levels ($Y_0$) while stabilizing interest rates. If this happens then the economy will be in a new equilibrium at $E_3$ which will yield higher output along with lower rates when compared to the original output and rates. Thus, a nuanced approach containing a mix of both the fiscal and monetary policies China’s economy can be boosted and can come out of it’s setbacks..
How the Measures Influence the Model
- Restoring Demand (IS Curve):
Fiscal measures, such as infrastructure spending, can shift the IS curve rightward to its original position, IS₀. - Enhancing Liquidity (LM Curve):
Lower interest rates and liquidity injections aim to shift the LM curve further downward/rightward, encourages borrowing and investment.
Conclusion
The IS-LM model provides a clear framework to analyze China’s economic challenges and the effects of monetary policy. While the PBOC’s measures address liquidity constraints and reduce borrowing costs, structural reforms and fiscal policies are essential to shift the IS curve back to its original position. Without a coordinated approach, the interplay between the goods and money markets may fail to restore China’s economy to its potential output, prolonging deflationary pressures and economic stagnation.
[…] The dramatic fall in China’s bond yields and its broader implications can be examined through the IS-LM model, a cornerstone of macroeconomic analysis. This model helps in understanding the interplay between interest rates (as reflected in bond yields), aggregate demand, and monetary policy effectiveness. Read more about the theoretical backing in the next post, we will delve deeper into the IS-LM framework to unpack the underlying problems in China’s economy, explore why deflationary pressures have intensified, and analyze the limitations of current policy responses. Read it here. […]
This felt like watching a high-stakes economic chess game, with deflation and bond yields as the warring pieces! Fantastic job of making economics both fun and understandable!
I never thought I’d find deflation and bond yields so engaging—this article turns complex concepts into a thrilling intellectual adventure. Definitely the economic rollercoaster I didn’t know I needed!